The Brooklyn Voter Purge: By Age, Registration and Sanders Districts
WNYC's analysis that Hispanics were disproportionally removed from Brooklyn voter rolls in 2015 has led to many more questions about the list of purged voters, which was obtained by WNYC under the state Freedom of Information Law. Here are some of those questions, and some answers.
What is the age breakdown of people who were purged?
Election officials initially suggested that the purge cleaned the rolls of hundreds of people who were older than 80, suggesting that they may have died. But 88 percent of the 122,454 people purged were younger than 80 years old at the time of the purge. The median age of those purged was 53.
Among the youngest registered voters, just 1 percent of those on the purge list were under 30, compared to about 15 percent of registered voters under 30 borough-wide as of November 2014.
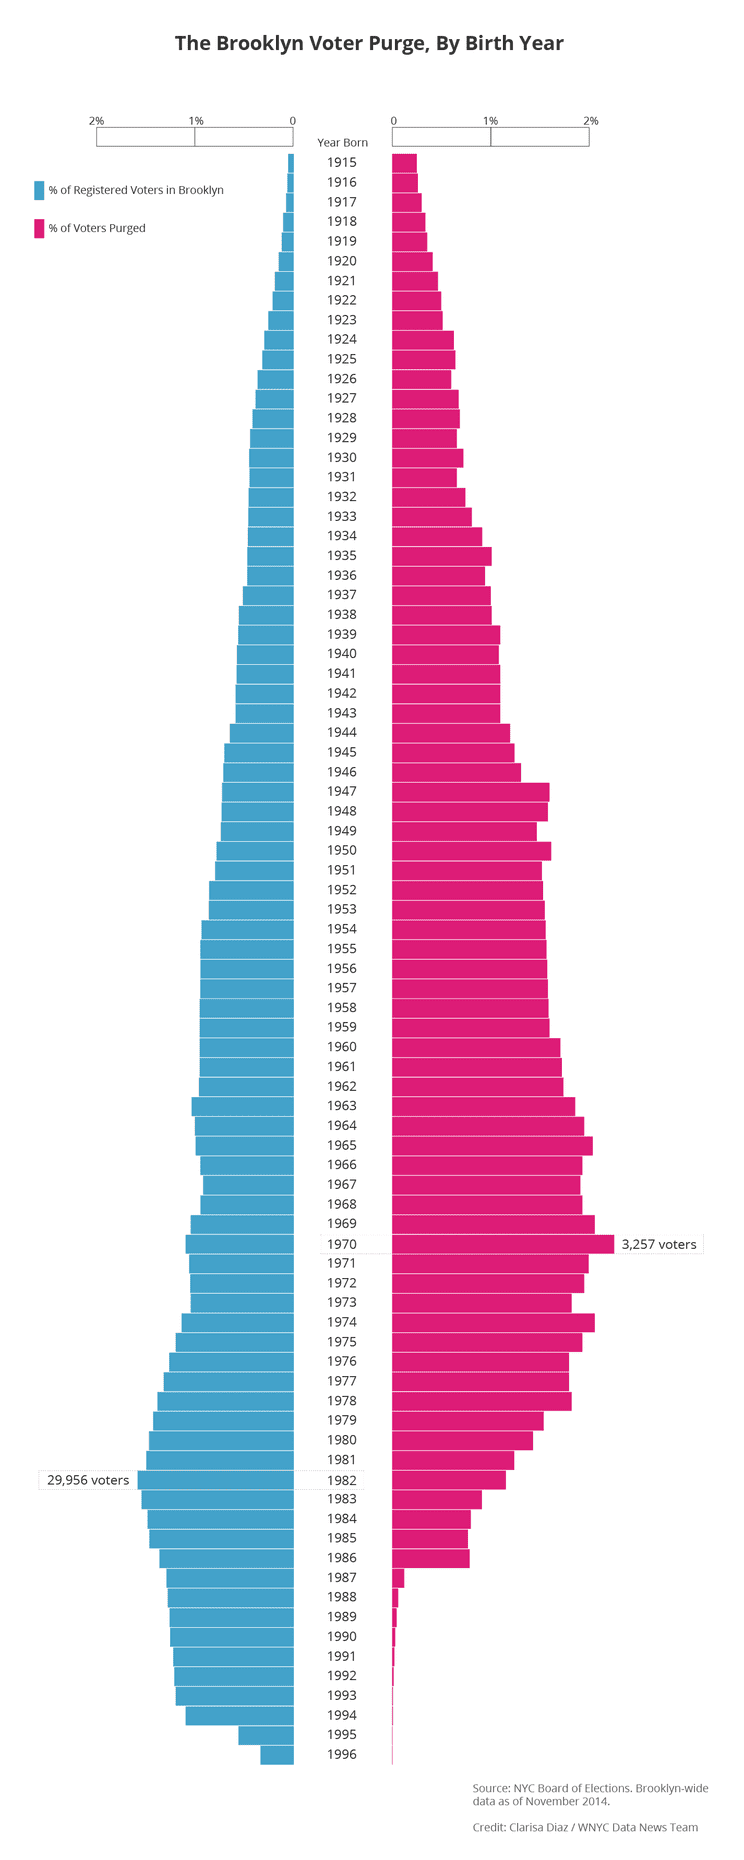
For the Brooklyn voter rolls as a whole, the median age was 47. So overall, those purged skewed slightly older than average.
What criteria were used for the purge?
Board of Elections Executive Director Michael Ryan told WNYC he's doesn't know what criteria were used by people in the Brooklyn office to mark names for purging, and that further information about the methods used likely won't be available while state and federal investigations are under way.
He did, however, offer an initial theory: "Near as I can figure it out, the standard was voter inactivity for a period of time and some combination of age."
Looking at the purge list, WNYC found that 96 percent of the people on the list registered by 2008 and either last voted in 2008 or earlier or never voted.
Another 100,000 or so registered voters who also fit those criteria were not purged. WNYC looked at the demographics of this set of "unpurged" voters and found they lined up closely with the demographics of those purged. That is, it includes a disproportionate number of Hispanic people.
So if the criteria was people who "registered by 2008 and last voted in 2008 or earlier or never voted," then that criteria appears not to have been applied consistently.
Were the purged voters all Democrats?
No.
Among the purged voters, 64.1 percent (78,536 voters) were Democrats, 10.5 percent (12,821 voters) were Republicans and the rest were registered to other parties or no party.
The makeup of the Brooklyn voter rolls in November 2014, before the purge, was 71.4 percent Democrats and 8.7 percent Republicans.
Did the purge have an impact on Clinton or Sanders voters?
Apparently, yes. Equally.
Maybe.
Here's the deal: We know where Clinton and Sanders won. And we know how many Democrats were purged in each of those election districts. But we don't know who the purged voters would have voted for, and we can't be certain how many tried to vote.
All of that said, the Democrats were purged at similar rates in election districts where Clinton won (8.2 percent purged) and where Sanders won (8.4 percent).
In raw numbers, 60,523 Democrats were purged in districts that went for Clinton, and 15,527 were purged where Sanders won.
(Our totals don't account for every Democratic purged voter because some couldn't be matched to any Brooklyn election district, some matched districts where there were no votes in the primary and some were in districts where the candidates tied.)
Clinton beat Sanders in Brooklyn by 57,909 votes, and won New York State by 290,614 votes.

WNYC is funded by sponsors and member donations